Point referenced data (pt. 2)

Lecture 22

Dr. Colin Rundel

Loa Loa Example

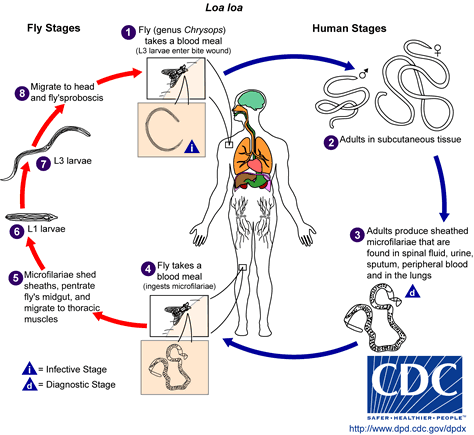
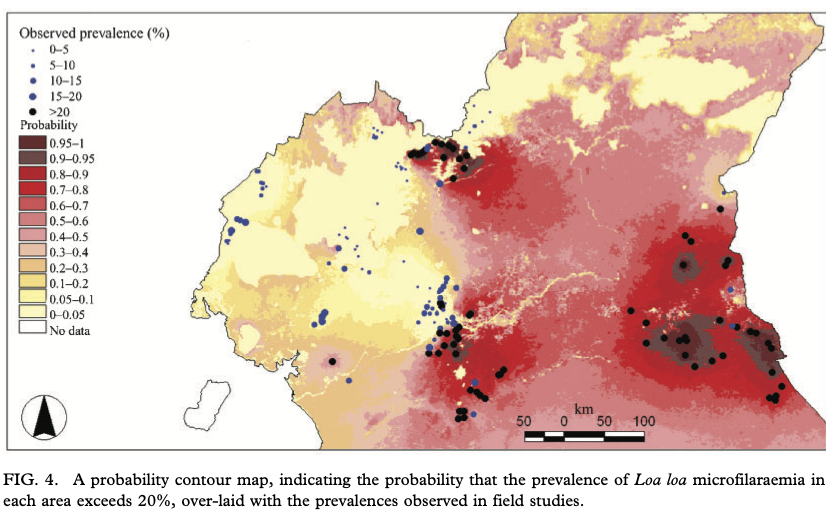
Loa Loa

Data

loaloa = PrevMap::loaloa %>%
  as_tibble() %>% 
  setNames(., tolower(names(.))) %>%
  rename(elev=elevation)

loaloa
# A tibble: 197 × 11
     row villcode longi…¹ latit…² no_exam no_inf  elev mean9…³ max9901
   <int>    <int>   <dbl>   <dbl>   <int>  <int> <int>   <dbl>   <dbl>
 1     1      214    8.04    5.74     162      0   108   0.439    0.69
 2     2      215    8.00    5.68     167      1    99   0.426    0.74
 3     3      118    8.91    5.35      88      5   783   0.491    0.79
 4     4      219    8.10    5.92      62      5   104   0.432    0.67
 5     5      212    8.18    5.10     167      3   109   0.415    0.85
 6     6      116    8.93    5.36      66      3   909   0.436    0.8 
 7     7       16   11.4     4.88     163     11   503   0.502    0.78
 8     8      217    8.07    5.90      83      0   103   0.373    0.69
 9     9      112    9.02    5.59      30      4   751   0.481    0.8 
10    10      104    9.31    6.00      57      4   268   0.487    0.84
# … with 187 more rows, 2 more variables: min9901 <dbl>,
#   stdev9901 <dbl>, and abbreviated variable names ¹​longitude,
#   ²​latitude, ³​mean9901

Spatial Distribution

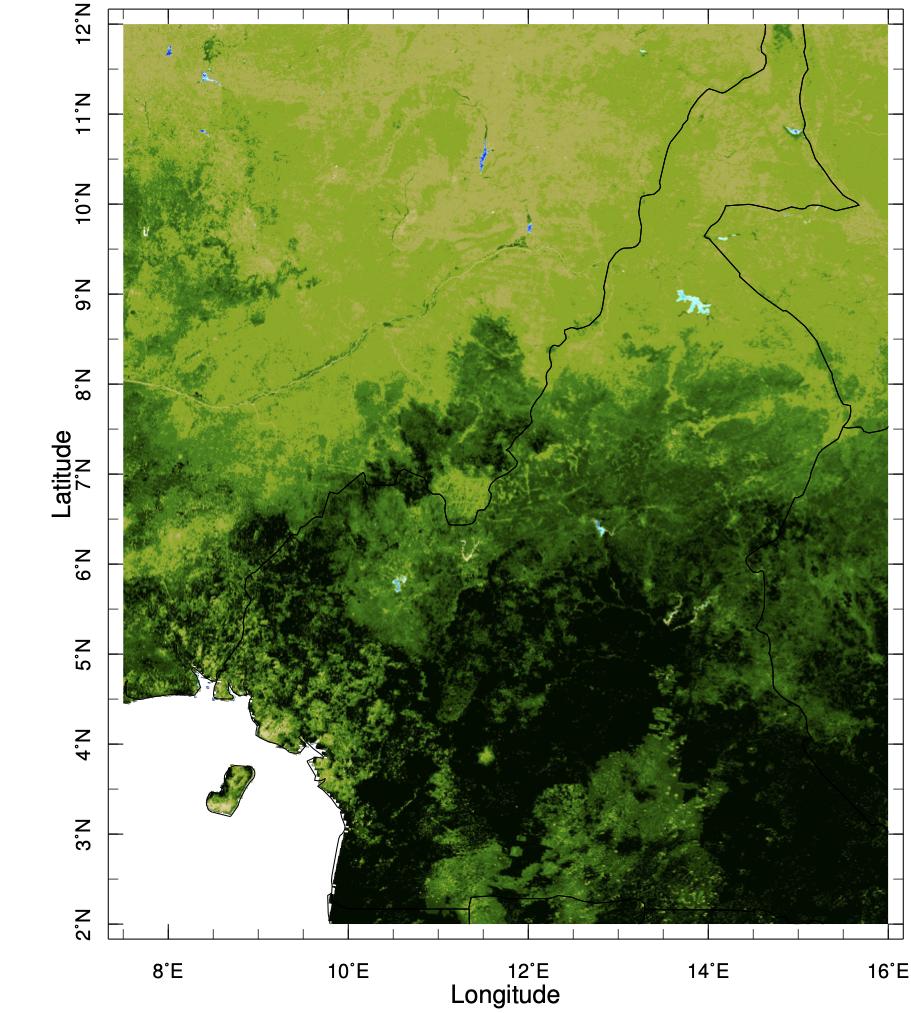
Normalized Difference Vegetation Index (NDVI)

Paper / Data summary

Original paper - Diggle, et. al. (2007). Spatial modelling and prediction of Loa loa risk: decision making under uncertainty. Annals of Tropical Medicine and Parasitology, 101, 499-509.

  • no_exam and no_inf - Collected between 1991 and 2001 by NGOs (original paper mentions 168 villages and 21,938 observations)

  • elev - USGS gtopo30 (1km resolution)

  • mean9901 to stdev9901 - aggregated data from 1999 to 2001 from the Flemish Institute for Technological Research (1 km resolution)

Diggle’s Model

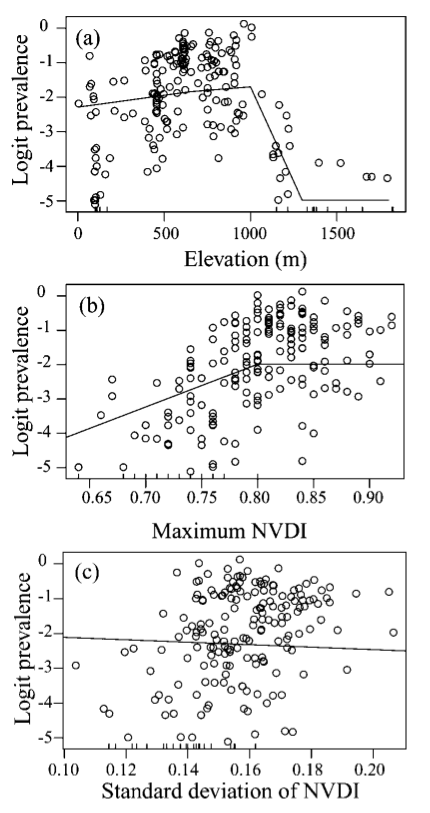
\[ \begin{aligned} \log \left( \frac{p(s)}{1-p(s)} \right) = \alpha &+ f_1(\text{elev}(s)) \\ &+ f_2(\text{MAX.NDVI}(s)) \\ &+ f_3(\text{SD.NDVI}(s)) + w(s) \end{aligned} \]

where

\[ w(s) \sim \mathcal{N}(0, \Sigma) \] \[ \{\Sigma\}_{ij} = \sigma^2 \, \exp(-d \,\phi) \]

EDA

Diggle’s EDA

Feature engineering

loaloa = loaloa %>% 
  mutate(
    elev_f = cut(elev, breaks=c(0,1000,1300,2000), dig.lab=5),
    max_f  = cut(max9901, breaks=c(0,0.8,1))
  )
loaloa %>% select(elev, elev_f, max9901, max_f)
# A tibble: 197 × 4
    elev elev_f   max9901 max_f  
   <int> <fct>      <dbl> <fct>  
 1   108 (0,1000]    0.69 (0,0.8]
 2    99 (0,1000]    0.74 (0,0.8]
 3   783 (0,1000]    0.79 (0,0.8]
 4   104 (0,1000]    0.67 (0,0.8]
 5   109 (0,1000]    0.85 (0.8,1]
 6   909 (0,1000]    0.8  (0,0.8]
 7   503 (0,1000]    0.78 (0,0.8]
 8   103 (0,1000]    0.69 (0,0.8]
 9   751 (0,1000]    0.8  (0,0.8]
10   268 (0,1000]    0.84 (0.8,1]
# … with 187 more rows

Model Matrix

model.matrix(
  ~ elev:elev_f - 1, 
  data = loaloa
) %>%
  as_tibble()
# A tibble: 197 × 3
   `elev:elev_f(0,1000]` `elev:elev_f(1000,1300]` elev:elev_f(1300,2…¹
                   <dbl>                    <dbl>                <dbl>
 1                   108                        0                    0
 2                    99                        0                    0
 3                   783                        0                    0
 4                   104                        0                    0
 5                   109                        0                    0
 6                   909                        0                    0
 7                   503                        0                    0
 8                   103                        0                    0
 9                   751                        0                    0
10                   268                        0                    0
# … with 187 more rows, and abbreviated variable name
#   ¹​`elev:elev_f(1300,2000]`

OOS Validation

set.seed(12345)
loaloa_test = loaloa %>% slice_sample(prop=0.20)
loaloa = anti_join(loaloa, loaloa_test, quiet=TRUE)

Model

g = glm(no_inf/no_exam ~ elev:elev_f + max9901:max_f + stdev9901, 
        data=loaloa, family=binomial, weights=loaloa$no_exam)
summary(g)

Call:
glm(formula = no_inf/no_exam ~ elev:elev_f + max9901:max_f + 
    stdev9901, family = binomial, data = loaloa, weights = loaloa$no_exam)

Deviance Residuals: 
    Min       1Q   Median       3Q      Max  
-7.2205  -2.4954  -0.7776   1.6020   9.9667  

Coefficients:
                         Estimate Std. Error z value Pr(>|z|)    
(Intercept)            -8.537e+00  5.408e-01 -15.785  < 2e-16 ***
stdev9901               6.750e+00  1.449e+00   4.659 3.18e-06 ***
elev:elev_f(0,1000]     1.467e-03  9.481e-05  15.471  < 2e-16 ***
elev:elev_f(1000,1300]  1.940e-04  9.279e-05   2.091   0.0365 *  
elev:elev_f(1300,2000] -1.506e-03  1.912e-04  -7.880 3.29e-15 ***
max9901:max_f(0,0.8]    6.399e+00  6.951e-01   9.207  < 2e-16 ***
max9901:max_f(0.8,1]    6.364e+00  6.387e-01   9.965  < 2e-16 ***
---
Signif. codes:  0 '***' 0.001 '**' 0.01 '*' 0.05 '.' 0.1 ' ' 1

(Dispersion parameter for binomial family taken to be 1)

    Null deviance: 3364.8  on 157  degrees of freedom
Residual deviance: 1630.8  on 151  degrees of freedom
AIC: 2256.4

Number of Fisher Scoring iterations: 5

Predictions - Training

Predictions - Testing

Fit - Training

Fit - Testing

Fit - RMSE

# Training
yardstick::rmse_vec(loaloa$no_inf/loaloa$no_exam, loaloa$glm_pred)
[1] 0.11176
# Testing
yardstick::rmse_vec(loaloa_test$no_inf/loaloa_test$no_exam, loaloa_test$glm_pred)
[1] 0.1192507

Spatial Structure?

geoR::variog(coords = cbind(loaloa$longitude, loaloa$latitude), 
       data = loaloa$prop - loaloa$glm_pred,
       uvec = seq(0, 4, length.out = 50)) %>% plot()
variog: computing omnidirectional variogram

gpglm model

ll_gp = gpglm(
  no_inf ~ scale(elev):elev_f + scale(max9901):max_f + scale(stdev9901), 
  data = loaloa, family="binomial", weights=loaloa$no_exam,
  coords = c("longitude", "latitude"),
  cov_model="exponential",
  starting = list(
    beta=rep(0,7), 
    phi=3, sigma.sq=1, w=0
  ),
  priors = list(
    beta.Normal=list(rep(0,7), rep(10,7)),
    phi.unif=c(3/4, 3/0.25), sigma.sq.ig=c(2, 2)
  ),
  tuning = list(
    "beta"=rep(0.1, 7),
    "phi"=0.6, "sigma.sq"=0.3, "w"=0.1
  ),
  n_batch = 400,
  batch_len = 50,
  verbose = TRUE,
  n_report = 10,
  chains=4
)

saveRDS(ll_gp, file="Lec22_loaloa.rds")

ll_gp
# A gpglm model (spBayes spGLM) with 4 chains, 9 variables, and 80000 iterations. 
# A tibble: 9 × 10
  variable      mean median     sd    mad     q5     q95  rhat ess_b…¹
  <chr>        <dbl>  <dbl>  <dbl>  <dbl>  <dbl>   <dbl> <dbl>   <dbl>
1 (Intercept) -1.63  -1.64  0.282  0.254  -2.07  -1.17    1.03    68.4
2 scale(stde… -0.100 -0.101 0.0943 0.0930 -0.253  0.0587  1.01   451. 
3 scale(elev…  0.114  0.115 0.164  0.159  -0.156  0.383   1.01   225. 
4 scale(elev… -0.800 -0.803 0.283  0.278  -1.26  -0.328   1.02   318. 
5 scale(elev… -1.50  -1.50  0.264  0.261  -1.93  -1.07    1.01   359. 
6 scale(max9…  0.718  0.717 0.182  0.179   0.419  1.02    1.01   473. 
7 scale(max9…  0.100  0.100 0.150  0.148  -0.142  0.346   1.01   265. 
8 sigma.sq     1.04   0.982 0.300  0.237   0.683  1.57    1.01   521. 
9 phi          3.08   2.95  1.03   0.935   1.63   4.94    1.01   445. 
# … with 1 more variable: ess_tail <dbl>, and abbreviated variable
#   name ¹​ess_bulk

Diagnostics

plot(ll_gp, vars=1:3)

plot(ll_gp, vars=4:6)

plot(ll_gp, vars=7:9)

Prediction (training)

ll_gp_pred = predict(
  ll_gp, 
  newdata=loaloa, 
  coords = c("longitude", "latitude"),
  thin = 25,
  verbose=FALSE
)

ll_gp_pred_y = tidybayes::gather_draws(ll_gp_pred, y[i]) %>%
  group_by(.chain, i) %>%
  summarize(
    post_p = mean(.value),
    q025 = quantile(.value, 0.025),
    q975 = quantile(.value, 0.975)
  )

Prediction - Testing

ll_gp_test_pred = predict(
  ll_gp, 
  newdata=loaloa_test, 
  coords = c("longitude", "latitude"),
  thin = 25,
  verbose=FALSE
)

ll_gp_test_pred_y = tidybayes::gather_draws(ll_gp_test_pred, y[i]) %>%
  group_by(.chain, i) %>%
  summarize(
    post_p = mean(.value),
    q025 = quantile(.value, 0.025),
    q975 = quantile(.value, 0.975)
  )

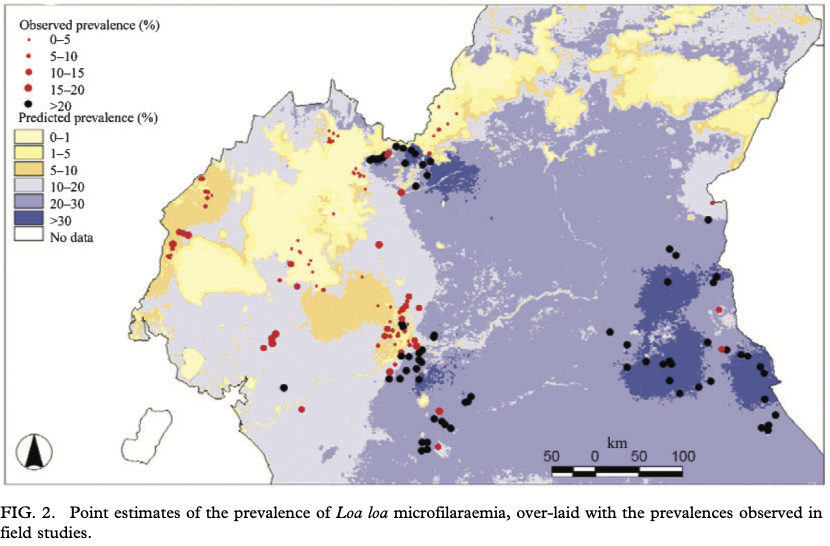
Diggle’s Predictive Surface

Exceedance Probability

Exceedance Probability Predictive Surface

Spatial Assignment of Migratory Birds

Background

Using intrinsic markers (genetic and isotopic signals) for the purpose of inferring migratory connectivity.

  • Existing methods are too coarse for most applications

  • Large amounts of data are available ( 150,000 feather samples from 500 species)

  • Genetic assignment methods are based on Wasser, et al. (2004)

  • Isotopic assignment methods are based on Wunder, et al. (2005)

Data - DNA microsatellites and \(\delta {}^2{H}\)

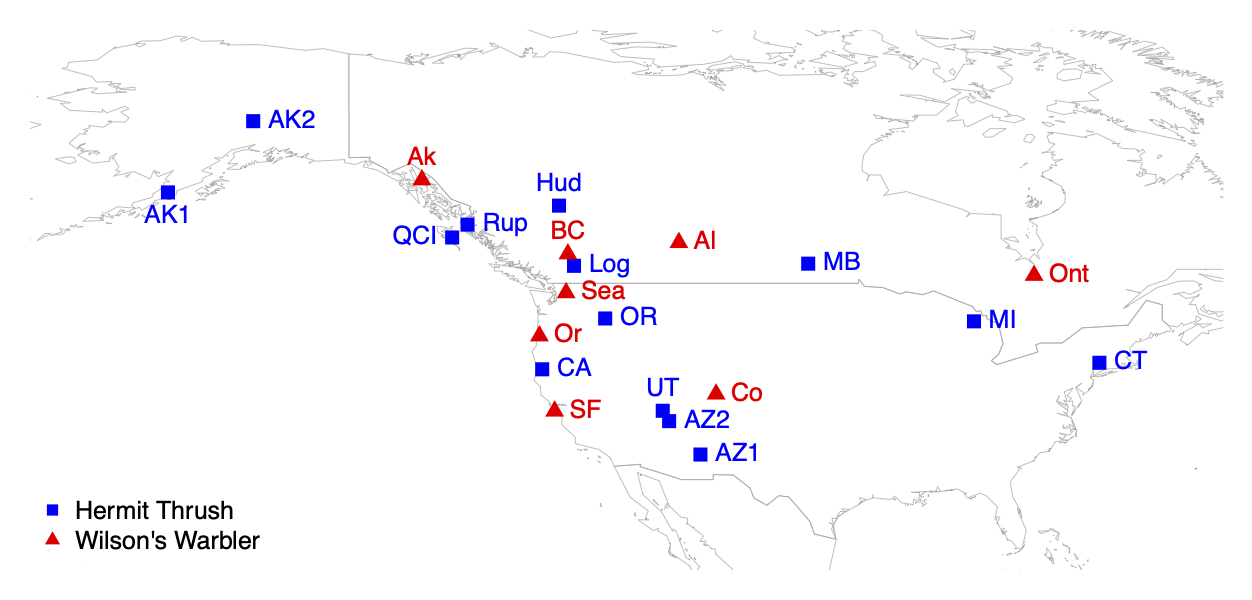
Hermit Thrush
(Catharus guttatus)
Wilson’s Warbler
(Wilsonia pusilla)
138 individuals 163 individuals
14 locations 8 locations
6 loci 9 loci
9-27 alleles / locus 15-31 alleles / locus

Sampling Locations

Allele Frequency Model

For the allele \(i\), from locus \(l\), at location \(k\)

\[ \begin{aligned} \boldsymbol{y}_{\cdot l k}|\boldsymbol{\Theta} &\sim \mathcal{N}\left(\textstyle\sum_i y_{ilk},\: \boldsymbol{f}_{\cdot l k}\right) \\ \\ f_{ilk} &= \frac{\exp(\Theta_{ilk})}{\sum_i \exp(\Theta_{ilk})} \\ \\ \boldsymbol{\Theta}_{il}|\boldsymbol{\alpha},\boldsymbol{\mu} &\sim \mathcal{N}( \boldsymbol{\mu}_{il},\, \boldsymbol{\Sigma_{}}) \\ \end{aligned} \]

\[ \left\{\Sigma\right\}_{ij} = \sigma^2 \, \exp \Big(-(\{d\}_{ij}\, r)^{\psi} \Big) + \sigma^2_n \, {1}_{i=j} \]

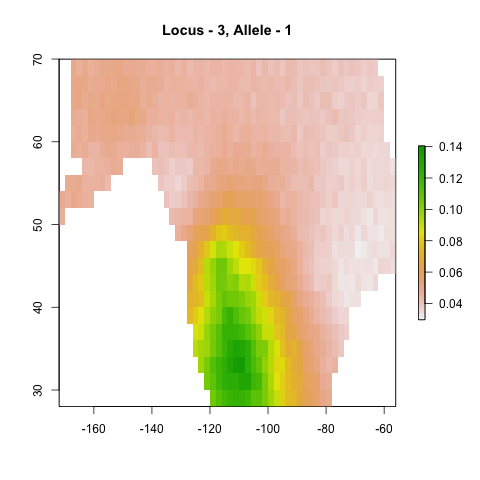
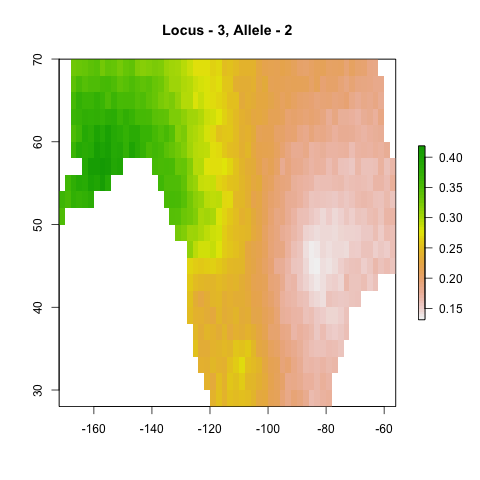
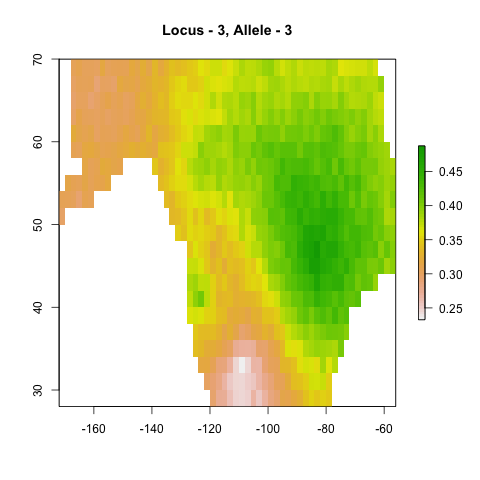
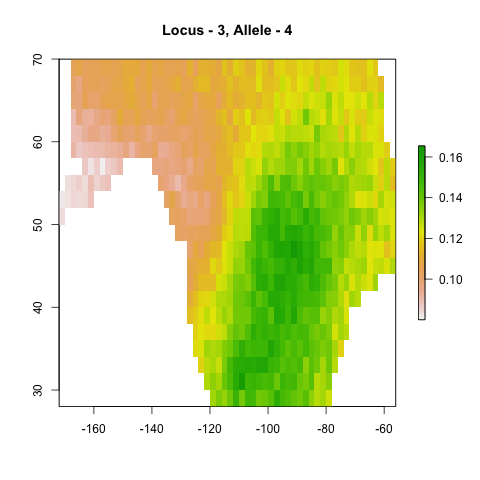
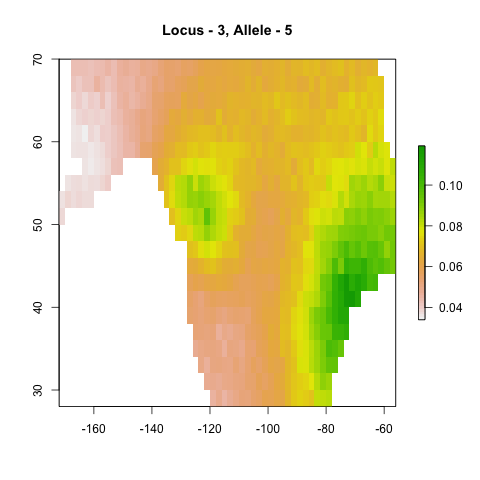
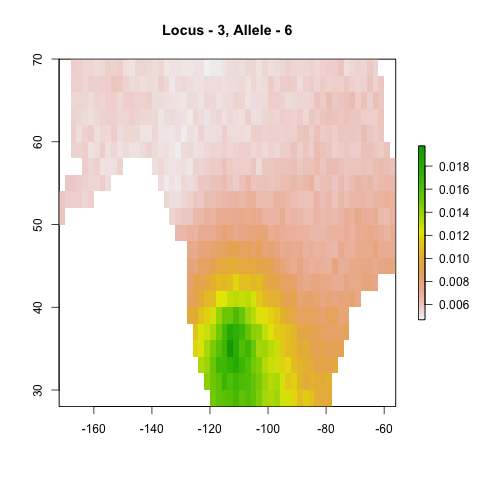
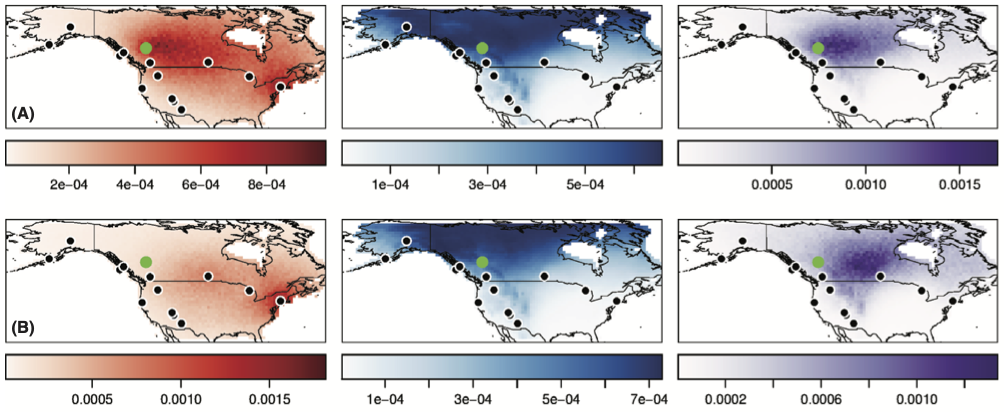
Predictions by Allele (Locus 3)

Genetic Assignment Model

Assignment model assuming Hardy-Weinberg equilibrium and allowing for genotyping (\(\delta\)) and single amplification (\(\gamma\)) errors.

\[ \begin{aligned} P(S_G|\boldsymbol{f},k) &= \prod_l P(i_l, j_l | \boldsymbol{f},k) \\ \\ P(i_l, j_l | \boldsymbol{f},k) &= \begin{cases} \gamma P(i_l|\boldsymbol{f},k) + (1-\gamma)P(i_l|\boldsymbol{\tilde f},k)^2 & \text{if $i=j$} \\ (1-\gamma) P(i_l|\boldsymbol{f},k) P(j_l|\boldsymbol{f},k) & \text{if $i \ne j$} \end{cases} \\ \\ P(i_l|\boldsymbol{f},k) &= (1-\delta) f_{lik} + \delta / m_l \end{aligned} \]

Combined Model


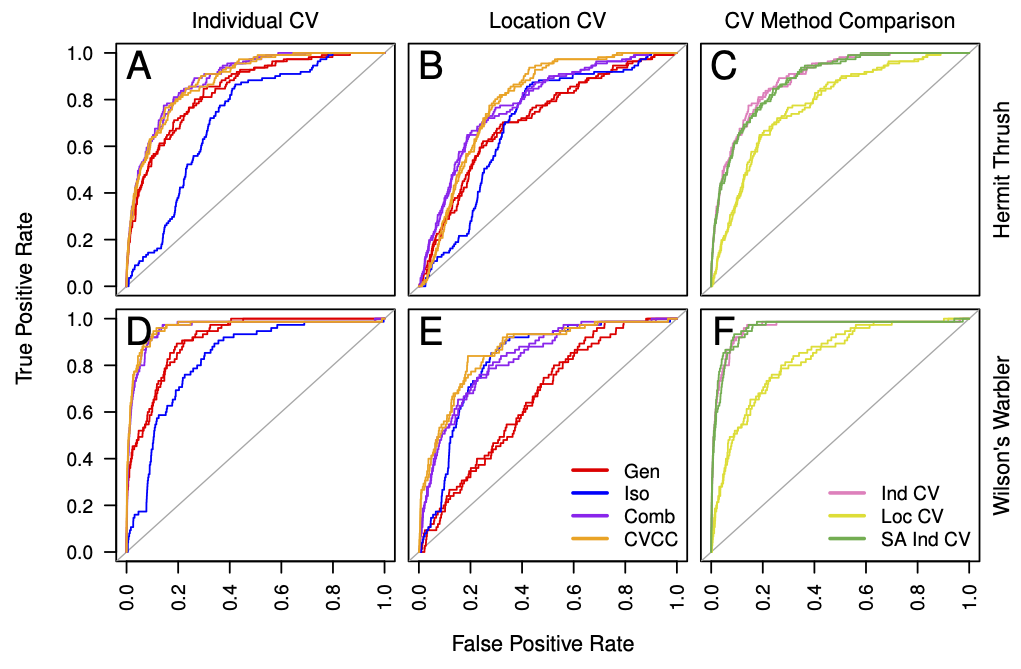
Model Assessment

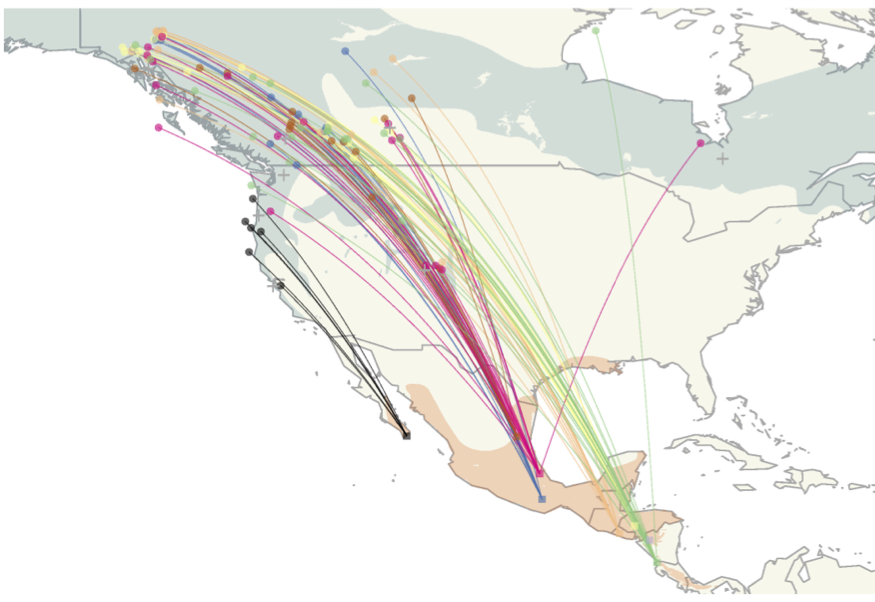
Migratory Connectivity